Why Cost Per Order Is the Most Important Metric in 3PL — and How It Helps Businesses Plan Better
Every e-commerce business that outsources fulfillment eventually asks the same question: “What is fulfillment actually costing me?” The answer usually arrives as a confusing stack of line items — receiving fees, storage fees, pick fees, packing fees, packaging materials, shipping, surcharges, returns processing. Each number is accurate on its own, but none of them tells you what you really need to know.
Cost per order (CPO) does. By rolling every fulfillment expense into a single number tied to the unit that actually generates revenue — the order — CPO becomes the clearest lens through which to evaluate a 3PL relationship, price products, and plan for growth. Here’s why it deserves to be the headline metric on every fulfillment dashboard, and how businesses can use it to plan smarter.
What Cost Per Order Actually Measures
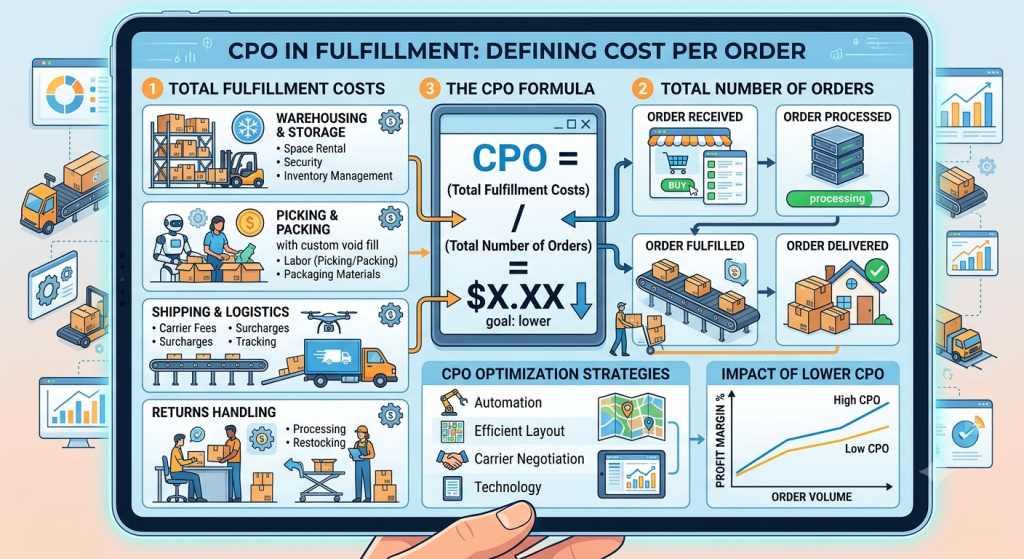
Cost per order is the total cost of fulfilling orders over a period, divided by the number of orders shipped in that period. Done properly, the numerator includes everything: pick and pack fees, storage allocated across orders, packaging materials, shipping and carrier surcharges, receiving costs amortized over the inventory received, returns processing, and any account management or software fees the 3PL charges.
The power of the metric is in that word “everything.” Individual fee lines invite selective attention — a seller might negotiate hard on the pick fee while a fuel surcharge quietly erodes margin in the background. CPO removes the hiding places. If total fulfillment spend was $18,400 last month across 4,000 orders, the business paid $4.60 to get each order out the door, full stop. That number can be tracked, benchmarked, and improved.
Why It Beats Every Other Fulfillment Metric
Other 3PL metrics matter — on-time shipping rate, order accuracy, inventory accuracy, dock-to-stock time. But these are operational health indicators. They tell you whether fulfillment is working; they don’t tell you whether it’s working economically. A 3PL can hit 99.8% accuracy and same-day shipping while still being the wrong financial fit for a business.
CPO is also the only fulfillment metric that connects directly to unit economics. Every e-commerce P&L ultimately comes down to what a business earns per order versus what it spends per order. Advertising teams live and die by cost per acquisition; fulfillment deserves the same discipline. When CPO sits next to average order value, gross margin per order, and customer acquisition cost, a business can see its true contribution margin in one glance — and that visibility is what separates companies that scale profitably from companies that scale into a hole.
There’s a comparison benefit as well. Fee schedules from different 3PLs are nearly impossible to compare line by line, because every provider structures pricing differently. One charges per pick with cheap storage; another bundles picks into a per-order fee but bills storage aggressively. Modeling each provider’s structure against your actual order profile and reducing it to a projected CPO is the only honest way to compare quotes. The 3PL with the lowest pick fee is frequently not the one with the lowest cost per order.
How CPO Turns Into Better Planning
The real value of cost per order shows up in the decisions it enables.
Pricing and promotion decisions become grounded. When a business knows its fulfillment cost per order with confidence, it can set free shipping thresholds that actually protect margin, decide which SKUs can survive a discount, and price bundles so that the extra picks don’t eat the upside. Without a reliable CPO, these decisions are guesses dressed up as strategy.
Growth forecasting gets realistic. Fulfillment costs don’t scale linearly. Storage fees grow with inventory depth, not order volume; peak-season surcharges arrive in Q4; a new sales channel might carry a different average order profile. A business that tracks CPO monthly can model how the number moves at 2x or 5x volume, and budget accordingly. It can also spot the inflection points where volume discounts kick in — the moments when it makes sense to consolidate inventory with one provider or renegotiate rates.
Inventory strategy improves. Because CPO absorbs storage costs, it exposes the true cost of slow-moving inventory. A SKU that turns twice a year drags the whole number up. Businesses that watch CPO tend to make sharper decisions about purchase quantities, liquidation timing, and which SKUs deserve placement in forward warehouses versus consolidated storage.
Network decisions become measurable. Should inventory sit in one warehouse or three? Splitting inventory raises receiving and storage complexity but can cut shipping zones dramatically. The only way to evaluate that trade-off is to model both scenarios as cost per order. Shipping is usually the largest single component of CPO, which means zone reduction is often the fastest lever for lowering it — but only the blended per-order number reveals whether the savings outrun the added overhead.
3PL accountability gets teeth. Quarterly business reviews with a fulfillment partner are far more productive when both sides are looking at CPO trends rather than arguing over individual invoice lines. If CPO crept up 8% over two quarters, the conversation becomes diagnostic: was it carrier rate increases, a shift in order mix, more surcharges, or slower-moving inventory? The metric doesn’t just measure the relationship — it structures the conversation about improving it.
Making the Metric Honest
CPO only works if it’s calculated consistently. Three practices keep it trustworthy. First, include all costs, even the awkward ones like returns processing and packaging — a CPO that excludes returns flatters the business and misleads planning. Second, segment when order profiles differ meaningfully: a single-item lightweight order and a three-box oversized order should not be averaged into one number if the business sells both at scale. Calculating CPO per channel or per product category reveals which parts of the business are actually profitable. Third, track it over time on a fixed cadence. A single month’s CPO is a data point; twelve months of CPO is a planning tool that exposes seasonality, carrier rate creep, and the real impact of every operational change.
Fulfillment is one of the largest controllable costs in e-commerce, and cost per order is the metric that makes it controllable. It condenses a dozen fee lines into a single number that connects directly to margin, makes 3PL providers genuinely comparable, and gives businesses a foundation for pricing, forecasting, inventory, and network decisions that would otherwise rest on intuition. Operational metrics tell you whether your fulfillment is running well. Cost per order tells you whether your business model is running well — and that’s the question that matters most.
HoMart’s free 3PL Cost Calculator combines pick and pack, storage and packaging into one clear cost-per-order number — so you can price with confidence, protect your margins, and plan for growth. Get your true cost per order in minutes. Try it free today.